Open a site by clicking View Site to see its full detailed view. At the top you will find the site name, a dropdown (⌄) to switch between sites, and three action buttons: Add units, Add area, and Edit site.

Below that, the site has four views: Table view, Graph view, Floorplan view, and Sensor Events.
Site Details
The Site Details section at the top shows:
- The site's address
- Its description (if one has been added)
- How many areas and units are in the site
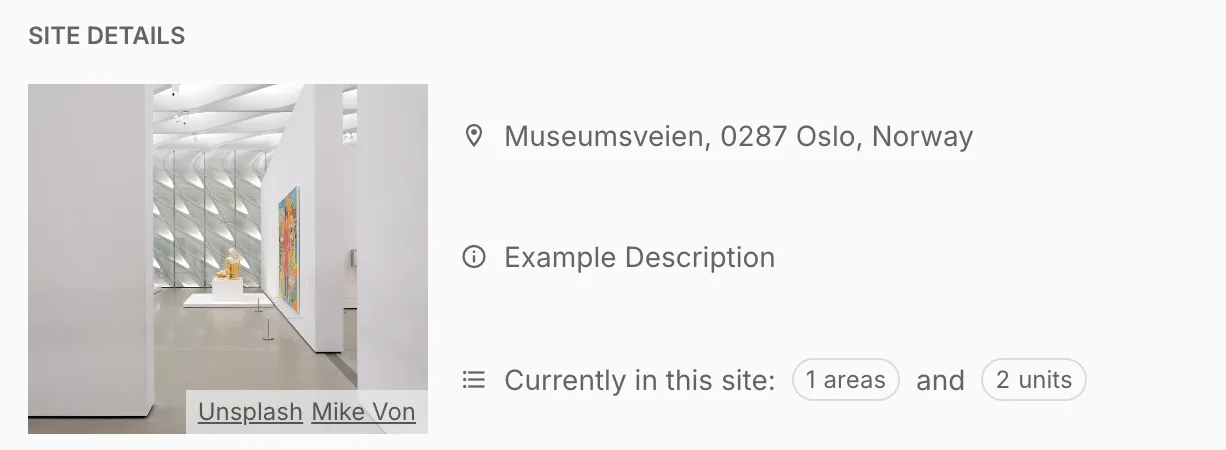
Click Show details or Hide details to expand or collapse this section.
Table view
Table view is the default. It shows all sensors in the site organised by area, with three columns:
- Area Name: the room or zone the sensor belongs to
- Current Readings: the latest readings from that sensor
- Connection: whether the sensor is currently transmitting data
Use the search bar to find a specific sensor, or the Filter button to narrow your selection.
Graph view
Graph view visualises sensor data over time. Select a sensor on the left to see its graph, choose parameters to overlay, and set a time range.
The controls are identical to those in Collections, including the ability to display threshold lines and global event markers directly on the chart. See Viewing your collection data for a full description.
Floorplan view
Floorplan view lets you upload a floor plan image and place sensors onto it, giving you a visual map of where each sensor sits within the building.
This is especially useful for larger sites with many rooms, where a visual layout makes it easier to locate sensors at a glance.
Sensor Events
The Sensor Events view is a timestamped log of everything that has happened at the site. Use the All units dropdown to filter by sensor and the search bar to find a specific event. It is split into three tabs:
- Threshold Events: every time a sensor crossed a threshold. Each row shows the sensor and what happened, Entered warning zone, Entered critical zone, or Returned to normal (colour-coded yellow, red, and green), the Measured value at the time, the Rule that was triggered, and a Timestamp. Expand a row for more detail.
- Comments: notes added manually to the timeline.
- Global Events: site-wide events such as connectivity drops. Use + Create global event to log one yourself.
Events are paged, use the arrows at the bottom to move through the history.